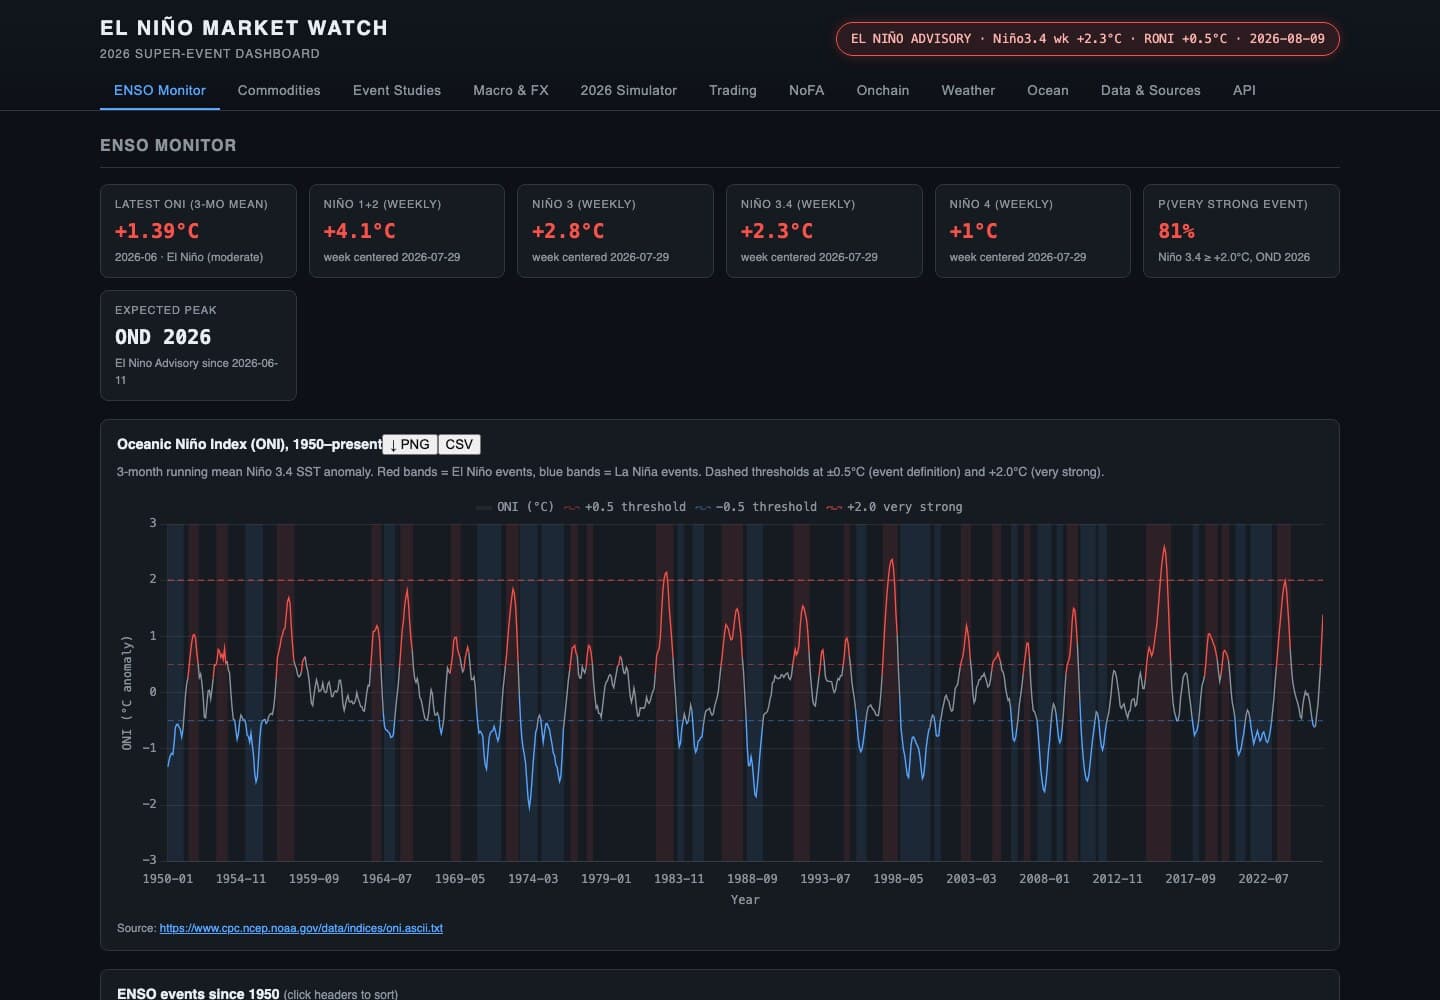
El Niño begins in the equatorial Pacific, thousands of kilometres from a trading desk. Its effects do not stay there. Rain shifts away from one growing region and into another; harvest risk changes; food prices, currencies and energy demand can move in response. The information exists — but it lives in different worlds. Ocean observations sit with climate agencies, crop weather in another set of feeds, market history in spreadsheets, positioning in weekly reports, and the trading story mostly in prose.
That fragmentation makes it easy to tell a convincing story and hard to test one.
So we built Enso: a live climate-to-market research system for the 2026–27 El Niño. It connects the physical event to historical market behaviour, labelled scenarios, a transparent paper-trading agent and machine-readable data products. Its core design rule is simple: every number must be sourced, derived in public view, or clearly labelled as a model scenario. If a feed fails, the value is unavailable — never invented.
The ocean is the first screen, not the conclusion
Enso starts with the state of the event itself: NOAA’s Oceanic Niño Index, weekly Niño-region temperatures, RONI, the Southern Oscillation Index and the Indian Ocean Dipole. Live NOAA maps add the physical anatomy — sea-surface temperature, subsurface heat, trade-wind anomalies, convection and buoy observations.
Then the system moves outward. Weather panels compare rainfall, temperature and root-zone soil wetness across ten commodity-growing regions using ERA5 and NASA POWER. Market panels join long-run commodity prices, macro indicators, FX, current or delayed contract prices and CFTC positioning. Twelve focused views let a user move from ocean state to commodities, past events, macro effects, scenarios, trade research, weather and the underlying sources without leaving the evidence chain.
The source is not hidden in a methodology PDF. It sits on the panel. The Data & Sources view exposes the exact upstream URL and the derivation path from raw series to the JSON behind each chart.
Fourteen events become a testable market history
A chart of the current El Niño says nothing by itself about what a market might do. Enso rebuilds the record around 14 historical El Niño events and 21 commodities. Each price series is aligned to event onset and indexed to 100, producing a median path, a 25th–75th percentile range and the individual event paths behind it.
That distinction matters. A median can suggest a pattern; the underlying paths show how inconsistent it may be. Event-study panels put the strongest analogues — 1982–83, 1997–98, 2015–16 and 2023–24 — beside sourced accounts of what actually happened. The simulator can rescale the historical composite to a chosen El Niño intensity and inventory regime, but it labels the result for what it is: a historical scenario, not a forecast.
The product does not turn correlation into certainty. It makes the correlation inspectable.
A paper agent that has to explain every decision
The sharpest test of research is whether it can survive contact with a decision. We built NoFA — “Not Financial Advice” — as a deterministic paper-trading agent, not an AI oracle. Each daily run asks which eligible asset has the strongest long case and which has the strongest short case between the current event offset and the scenario peak.
The score is visible: expected composite return × historical hit rate, discounted when the Wilson 95% confidence interval is weak, then checked for crowded managed-money positioning in CFTC data. If no negative candidate exists, the short side remains cash; the system never forces a trade to make the screen look busy. Prices are marked only when contract and historical units can be reconciled explicitly. Otherwise the mark stays stale or falls back to a clearly labelled monthly benchmark.
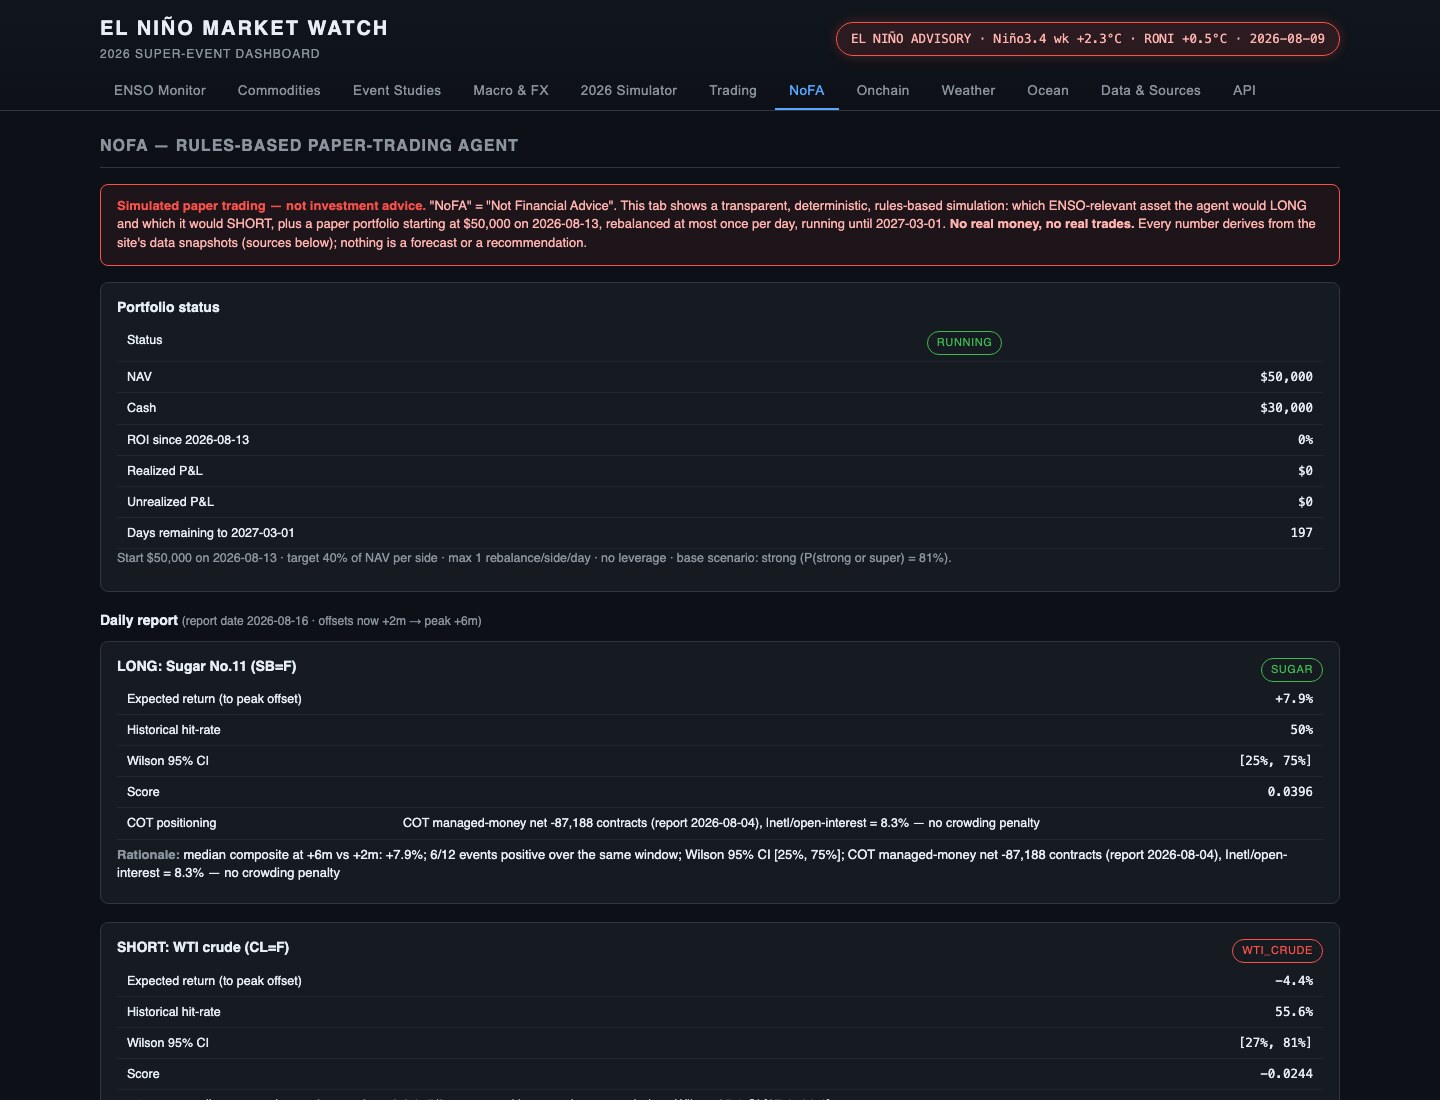
The paper account started at $50,000 with no leverage and at most one rebalance per side per day. That is not a performance claim. It is a live audit trail: recommendation, action, price basis, position, P&L and methodology on one screen.
Data for agents; execution behind a separate gate
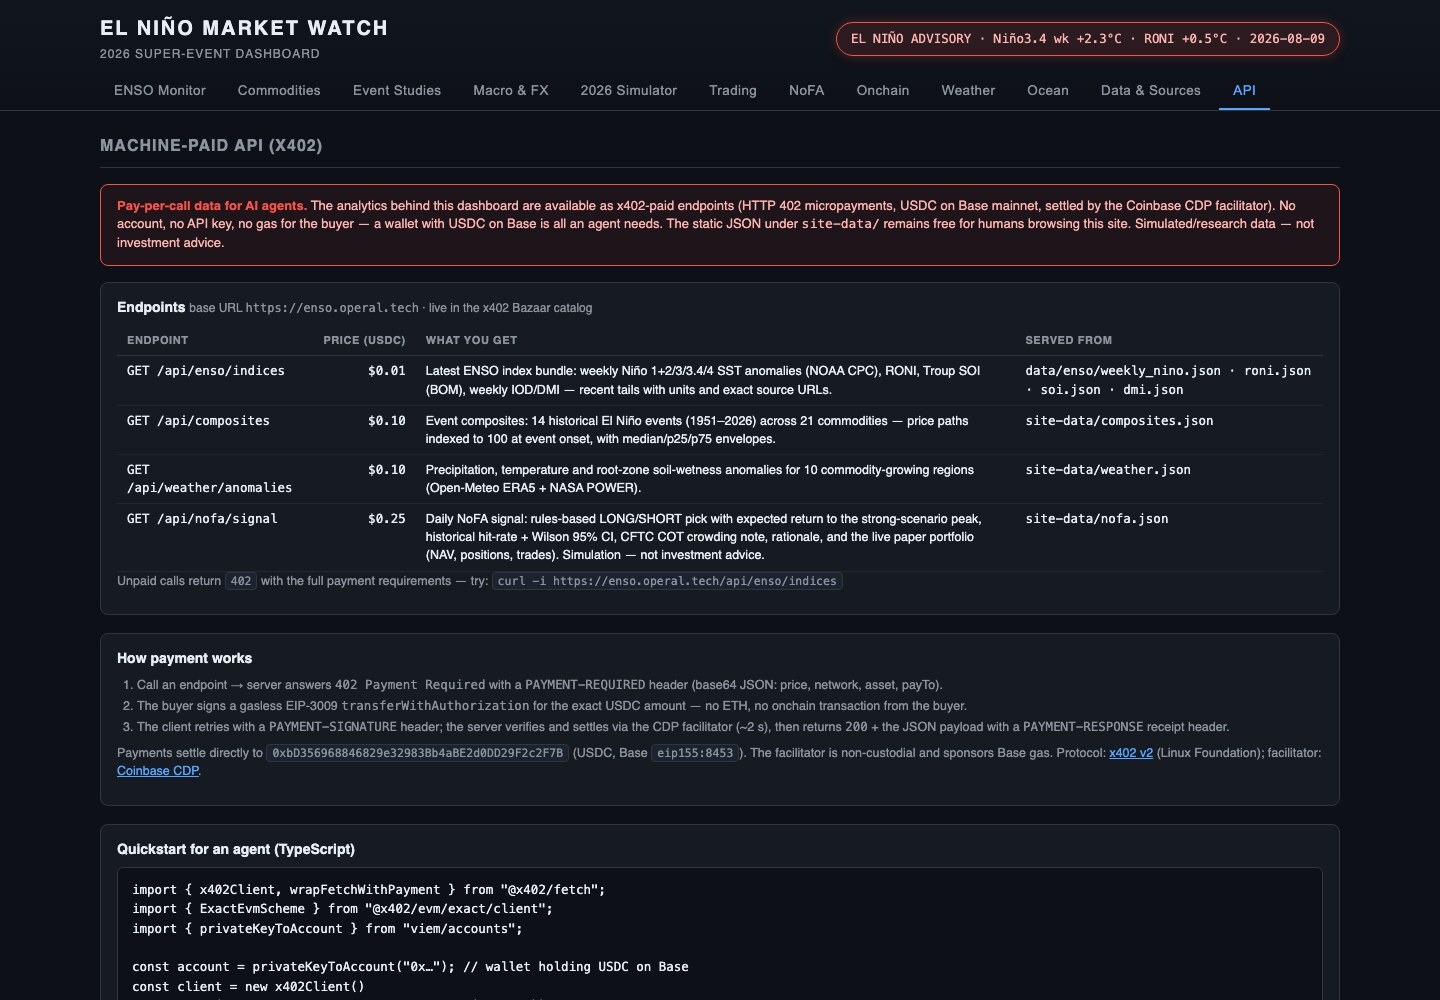
Four parts of the same research stack are available to machines through x402 pay-per-call endpoints: a bundled ENSO state, the event composites, growing-region weather anomalies and the daily NoFA signal. An AI agent can discover a service, pay cents in USDC and receive source-bearing JSON without an account or API key. Humans can still inspect the same underlying artifacts free on the site.
Execution is deliberately a different system boundary. Enso maps eligible signals to markets on Ostium, an on-chain perpetuals venue on Arbitrum, and exposes unsupported legs instead of silently substituting them — agricultural softs, for example, are not listed. The local execution agent defaults to a dry run; a live run requires local wallet material, explicit configuration and typed confirmation. The private key stays off the site and outside the AI workflow.
At publication, the dashboard showed a dry-run plan and no executed on-chain trades. It also placed Ostium’s recent oracle-security incident above the execution controls. That is the point of the boundary: an available route to action should never be mistaken for permission, safety or advice.
The product is the chain of evidence
Enso is a climate dashboard, an event-study engine, a scenario lab, a paper portfolio, an agent data service and a gated execution experiment. But the useful thing is not the number of features. It is that they form one traceable chain:
physical observation → sourced data → historical comparison → labelled scenario → explained paper decision → separately authorised action.
In a domain full of confident narratives, Enso does not promise certainty. It shows exactly how far the evidence goes — and where it stops.